The Social Security Administration states that “Most financial advisors say you’ll need about 70 percent of your pre-retirement earnings to comfortably maintain your pre-retirement standard of living. Under current law, if you have average earnings, your Social Security retirement benefits will replace only about 40 percent.” Progressives cite these seemingly puny benefits in support of expanding Social Security, despite the program’s $10 trillion-plus financial shortfall.
But, as Sylvester Schieber and I show in today’s Wall Street Journal, SSA and financial advisors calculate “replacement rates” differently. If you calculated replacement rates the way financial advisors do – by comparing Social Security benefits to earnings immediately preceding retirement – the typical replacement rate for a full-career worker is around 60 percent. SSA, by contrast, compares Social Security benefits to average lifetime earnings, which is fine, but it “wage indexes” those past earnings. Wage-indexing increases your past earnings by an amount greater than the rate of inflation, in effect crediting you with earnings you never had. A retirement income is then called inadequate if it can’t replace that never-had purchasing power.
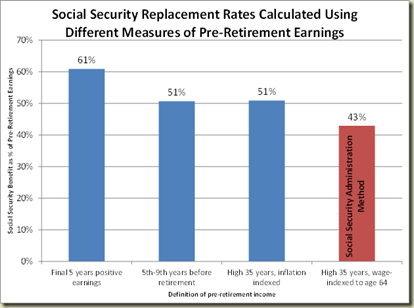
The chart below, from Schieber’s recent paper with Gaobo Pang of Towers Watson, shows five different ways of calculating Social Security replacement rates. From the left is initial Social Security benefits relative to: earnings in the 5 years before retirement; peak earnings (the 5th-9th years before retirement); the inflation-indexed average of the worker’s average lifetime earnings; and finally, the wage-indexed average of career earnings, which is how the SSA calculates replacement rates.
Of all the different ways of measuring replacement rates, SSA’s is by far the lowest. It also makes the least sense, since there’s nothing in the “life cycle” theory in economics or in standard financial planning in which people base their retirement saving on the growth of other people’s earnings, which is what wage-indexing does. It’s your own earnings, and smoothing your standard of living between work and retirement, that matter.
Why does SSA measure replacement rates the way it does? It’s a long story. But the short story is that we shouldn’t take it for granted that Social Security benefits fall far short of what financial planners recommend as an adequate retirement income.


1 comment:
I see that wage indexing produces a benefit lower than CPI indexing. Are you sure there is not a mistake here?
When I look calculate the replacement index rate by year using CPI and SSA wages I get larger SSA wage indexed benefits.
Is the CPI indexing method also indexing the bend points as well?
year wage cpi
1950
1951 15.83 8.92
1952 14.91 8.55
1953 14.12 8.52
1954 14.05 8.43
1955 13.42 8.49
1956 12.55 8.46
1957 12.17 8.21
1958 12.06 7.93
1959 11.49 7.82
1960 11.06 7.74
1961 10.85 7.61
1962 10.33 7.56
1963 10.08 7.46
1964 9.69 7.34
1965 9.51 7.26
1966 8.97 7.13
1967 8.50 6.89
1968 7.95 6.65
1969 7.52 6.37
1970 7.16 6.00
1971 6.82 5.69
1972 6.21 5.51
1973 5.85 5.32
1974 5.52 4.86
1975 5.14 4.35
1976 4.80 4.08
1977 4.53 3.87
1978 4.20 3.63
1979 3.86 3.32
1980 3.54 2.91
1981 3.22 2.61
1982 3.05 2.40
1983 2.91 2.32
1984 2.75 2.22
1985 2.63 2.15
1986 2.56 2.07
1987 2.41 2.04
1988 2.29 1.96
1989 2.21 1.87
1990 2.11 1.78
1991 2.03 1.68
1992 1.93 1.64
1993 1.92 1.59
1994 1.87 1.55
1995 1.79 1.51
1996 1.71 1.47
1997 1.62 1.42
1998 1.54 1.40
1999 1.45 1.38
2000 1.38 1.34
2001 1.35 1.29
2002 1.33 1.28
2003 1.30 1.25
2004 1.24 1.22
2005 1.20 1.19
2006 1.15 1.14
2007 1.10 1.12
2008 1.07 1.07
2009 1.09 1.07
2010 1.06 1.05
2011 1.03 1.03
2012 1.00 1.00
Post a Comment